What went into Surrey’s bins in 2021–22
The less recycling and rubbish that is produced, the better it is for the environment as it means that fewer resources are used to create and distribute products. And the more we recycle, the better it is as recycled material is used, instead of new resources, to create new products.
What happens when residents throw things away?
In Surrey, district or borough councils collect residents’ recycling and rubbish. It is the responsibility of Surrey County Council to dispose of it. Most material collected in Surrey in 2021-22 was recycled, composted or reused (54.4%). Of all the material collected from residents in 2021-22, 43% of it was put into rubbish bins with 27.9% sent to an energy from waste facility and 15.1% to landfill. More detail on what happens to rubbish can be found on page 13 of this report.
89.7% of recycling and rubbish was recycled or treated in the UK, which is an increase of 11.4 percentage points on the previous year. This means that fewer resources were used and emissions generated from transporting waste over borders.
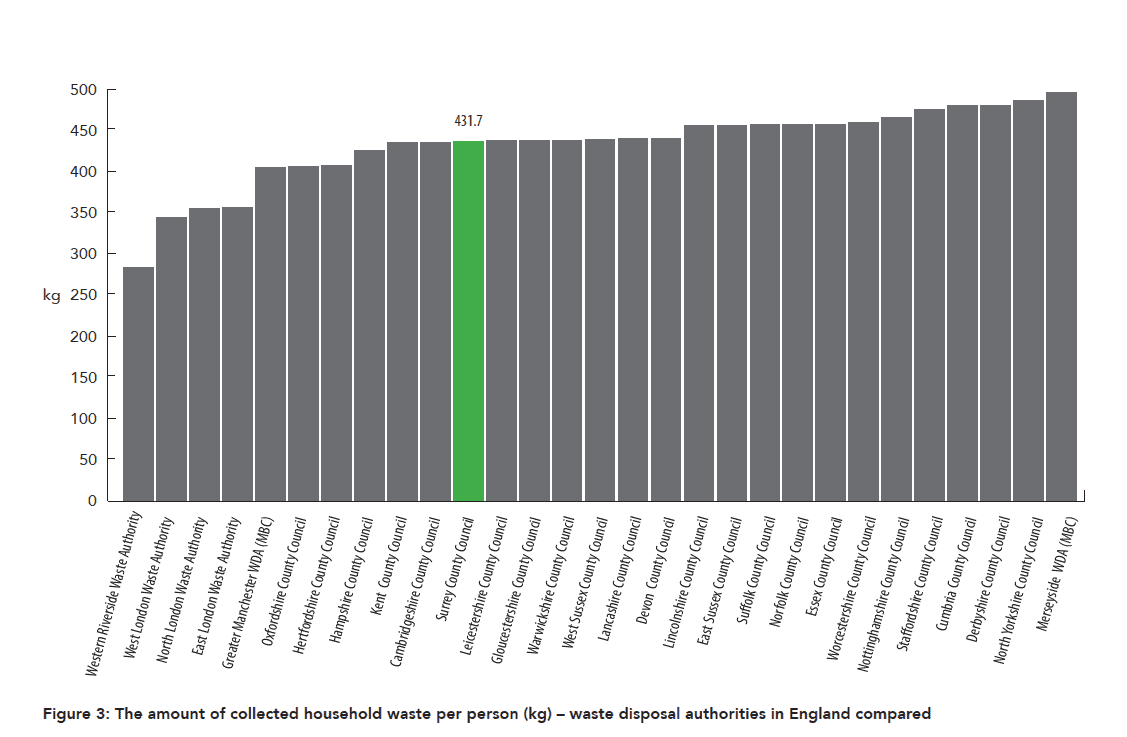
How does Surrey compare nationally?
To know how Surrey performs, we look at the amount of recycling and rubbish produced per person in the county. Surrey comes 11th out of 29 similar waste disposal authorities in England for recycling and rubbish per person (see Figure 3). Each resident produced an average of 431.7kg of recycling and rubbish. In total, 522,900 tonnes were produced in Surrey.
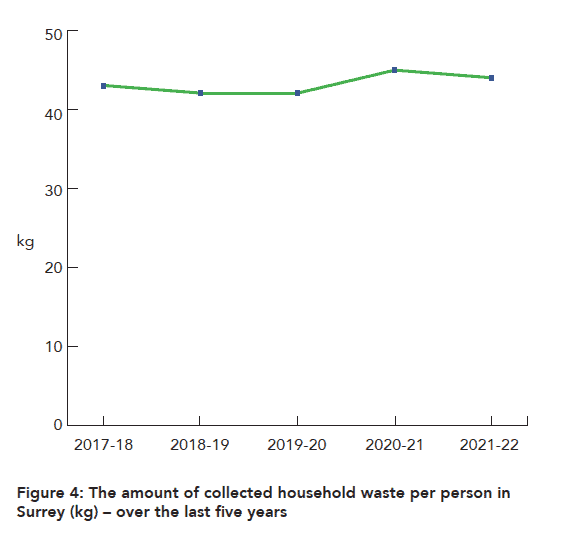
How are recycling and rubbish tonnages changing?
Compared to the previous year, which saw a rise in the amount of recycling and rubbish produced per person that was attributed to the effects of the pandemic, there was a reduction in 2021-22 by 16.5kg per person (3.1%). This is similar but slightly higher than the pre-COVID period, likely because not all people returned to office working (see Figure 4).